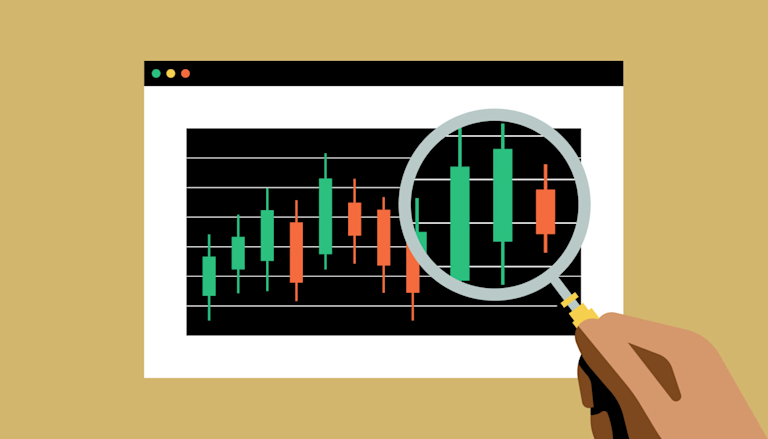
Mastering Trading Crypto Charts
In the rapidly evolving world of cryptocurrencies, having a solid grasp of trading crypto charts is crucial for both novice and experienced traders alike. Trading Crypto Charts visit website Understanding how to interpret these charts can mean the difference between making informed investment decisions and falling into the trap of emotional trading. In this article, we will explore the essential elements of crypto trading charts, including various chart types, key indicators, and strategies that can enhance your trading performance.
1. Understanding Different Types of Crypto Charts
When it comes to trading crypto charts, there are several types that traders commonly use. Each has its own unique features and serves different purposes.
1.1 Line Charts
Line charts are the simplest type of chart, displaying the closing prices of a cryptocurrency over a specific period. This chart type is beneficial for getting a quick overview of price movements, but it lacks detailed information about the intraday price fluctuations.
1.2 Bar Charts
Bar charts offer more information than line charts. Each bar represents the opening, closing, high, and low prices for a particular period. This makes bar charts excellent for understanding price movements and volatility over time.
1.3 Candlestick Charts
Candlestick charts are popular among traders due to their visual appeal and the breadth of information they convey. Each candlestick illustrates the same data as a bar chart, but it also shows whether the closing price was higher or lower than the opening price, indicated by the color of the candle. A green (or white) candle indicates a bullish trend, while a red (or black) candle suggests a bearish trend.
2. Key Indicators for Crypto Trading
While reading charts is essential, utilizing various indicators can help traders make more informed decisions. Here are some critical indicators to consider:
2.1 Moving Averages
Moving Averages (MAs) smooth out price data to help identify trends over a specific period. The two most common types are the Simple Moving Average (SMA) and the Exponential Moving Average (EMA). Traders often use crossovers between the short-term and long-term moving averages as signals for potential buy or sell opportunities.
2.2 Relative Strength Index (RSI)
The RSI is a momentum oscillator that measures the speed and change of price movements. It ranges from 0 to 100, indicating overbought (above 70) or oversold (below 30) conditions. Traders use the RSI to identify potential reversals in price trends.
2.3 MACD (Moving Average Convergence Divergence)
The MACD is a trend-following momentum indicator that shows the relationship between two moving averages of a security’s price. It consists of the MACD line, the signal line, and the histogram. Traders often look for crossovers between the MACD line and the signal line as signals to enter or exit trades.
3. Developing a Trading Strategy
Having a successful trading strategy is vital for navigating the volatile crypto market. Here’s how to develop a robust trading strategy incorporating trading crypto charts and indicators.

3.1 Set Clear Goals
Before diving into trading, it’s essential to set clear goals. Whether you’re aiming for short-term gains or long-term investments, knowing your objectives will help shape your strategy.
3.2 Risk Management
Effective risk management is critical to long-term success. Always determine how much of your capital you are willing to risk on a single trade. One common approach is to limit this to 1-2% of your total capital.
3.3 Backtesting
Before implementing your strategy in real-time trading, backtest it using historical data. This process helps you understand how your strategy would have performed in the past and can provide insights into possible adjustments.
4. Emotional Discipline in Trading
Emotional discipline is a cornerstone of trading success. The crypto market is notorious for its volatility, often causing traders to react impulsively.
4.1 Avoiding FOMO and FUD
Fear of missing out (FOMO) and fear, uncertainty, and doubt (FUD) are common emotional pitfalls. Having a pre-defined trading plan can help you stay grounded and resist the urge to make snap decisions based on market hype or fear.
4.2 Journaling Your Trades
Maintaining a trading journal helps you track your trades, strategies, and emotions. Reviewing your motives behind winning or losing trades can provide valuable lessons and enhance your emotional discipline.
5. Continuous Learning and Adaptation
The cryptocurrency landscape is constantly evolving, making continuous learning essential for traders. Stay updated on market trends, new technologies, and trading strategies by engaging with online communities, following news outlets, and taking courses.
5.1 Joining Online Communities
Participating in online forums and communities can provide insights from other traders and allow for the exchange of ideas and strategies. Platforms like Reddit, Discord, and specialized trading forums can serve as valuable resources.
5.2 Keeping Up with News and Events
Cryptocurrency prices can be significantly impacted by news events. Be sure to follow credible news sources and stay informed about developments in the crypto space. Market sentiment can shift rapidly, and being aware of external factors can help inform your trading strategy.
Conclusion
Mastering trading crypto charts is an ongoing journey that requires commitment, discipline, and continuous learning. By understanding different chart types, applying key indicators, developing a robust trading strategy, and practicing emotional discipline, you will be better equipped to navigate the volatile cryptocurrency market. Remember that trading is an art that combines both analytical skills and emotional intelligence. Always be willing to adapt and learn from your experiences to enhance your trading success.

Leave a Reply